Create a ggplot map. It fills by plan or argument fill. If both are supplied, plan is used as the color and fill as the alpha parameter.
redist.plot.map(
  shp,
  adj,
  plan = NULL,
  fill = NULL,
  fill_label = "",
  zoom_to = NULL,
  boundaries = is.null(fill),
  title = ""
)
Arguments
- shp
A SpatialPolygonsDataFrame, sf object, or redist_map. Required.
- adj
A zero-indexed adjacency list. Created with redist.adjacency if not supplied and needed for coloring. Default is NULL.
- plan
<data-masking>A numeric vector with one entry for each precinct in shp. Used to color the districts. Default isNULL. Optional.- fill
<data-masking>A numeric/integer vector with values to color the plot with. Optional.- fill_label
A string title of plot. Defaults to the empty string
- zoom_to
<data-masking>An indexing vector of units to zoom the map to.- boundaries
A logical indicating if precinct boundaries should be plotted.
- title
A string title of plot. Defaults to empty string. Optional.
Value
ggplot map
Examples
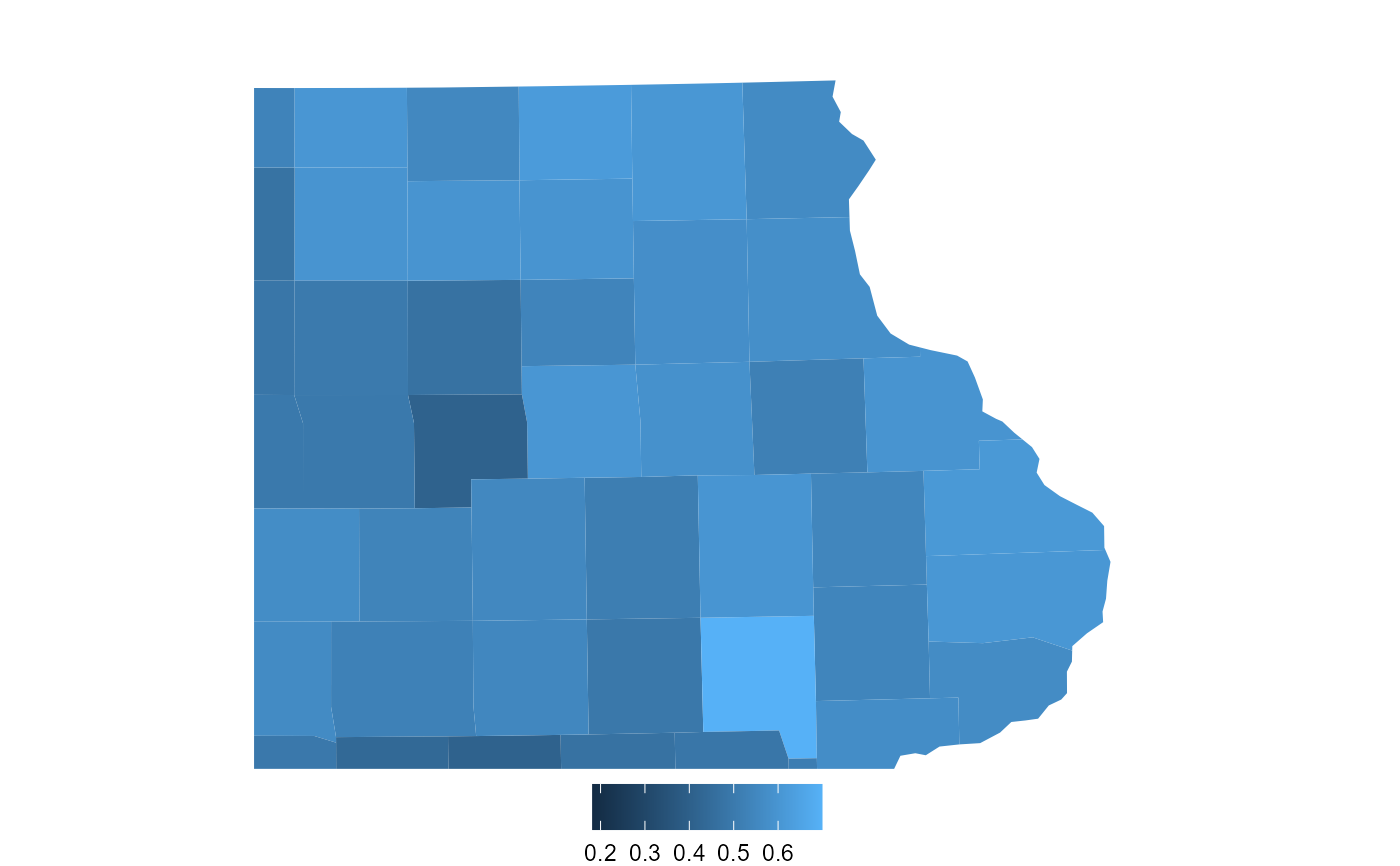
data(iowa)
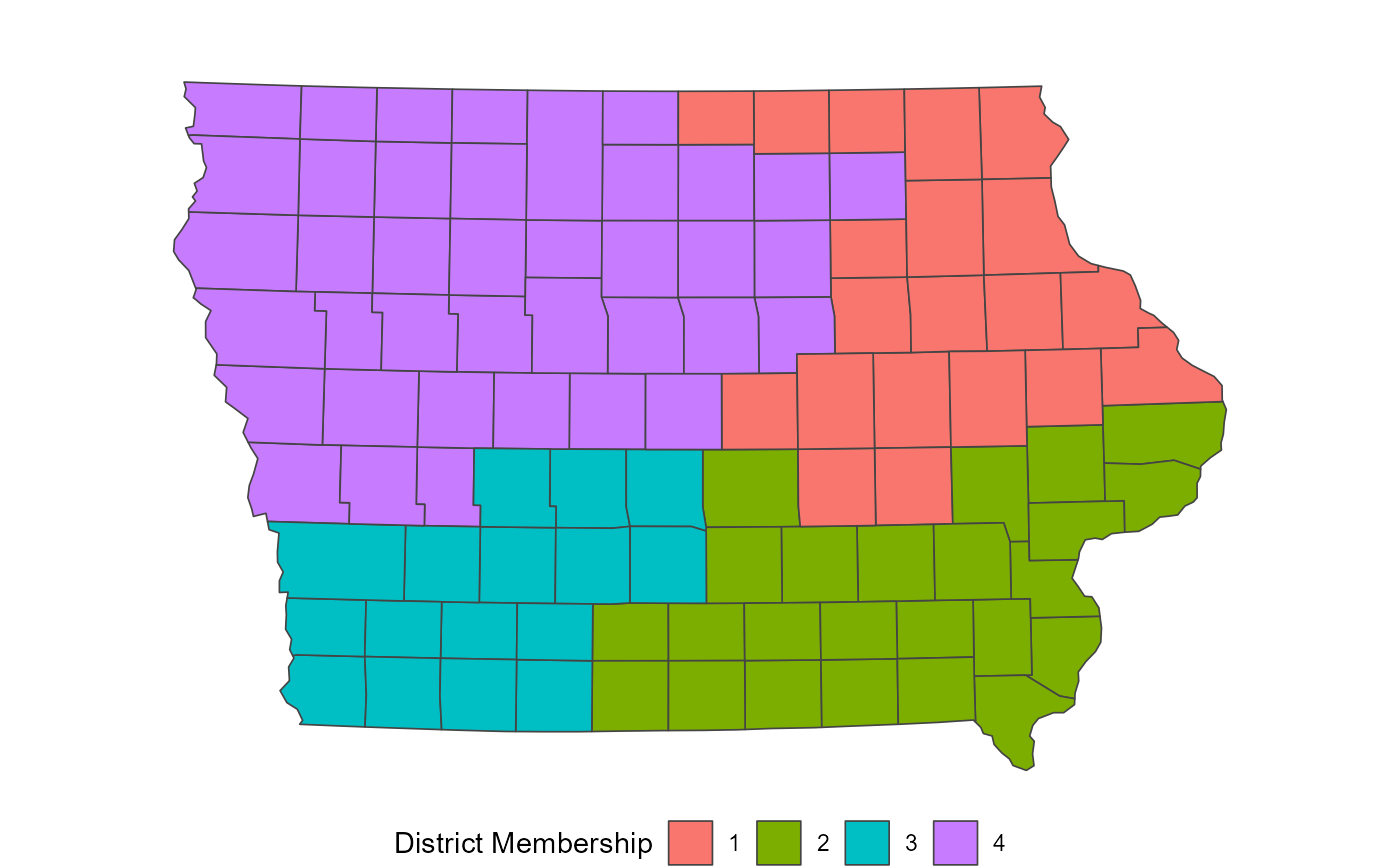
redist.plot.map(shp = iowa, plan = iowa$cd_2010)
 iowa_map <- redist_map(iowa, existing_plan = cd_2010)
#> `pop_tol` calculated from existing plan is ≤ 0.1%
redist.plot.map(iowa_map, fill = dem_08/tot_08, zoom_to = (cd_2010 == 1))
iowa_map <- redist_map(iowa, existing_plan = cd_2010)
#> `pop_tol` calculated from existing plan is ≤ 0.1%
redist.plot.map(iowa_map, fill = dem_08/tot_08, zoom_to = (cd_2010 == 1))